[Avg. reading time: 8 minutes]
Grafana
Grafana is an open-source analytics and visualization platform that allows you to query, visualize, alert on, and understand your metrics from various data sources through customizable dashboards.
- Provides real-time monitoring of IoT device data through intuitive dashboards
- Supports visualization of time-series data (which is common in IoT applications)
- Offers powerful alerting capabilities for monitoring device health and performance
- Enables custom dashboards that can display metrics from multiple IoT devices in one view.
- InfluxDB is optimized for storing and querying time-series data generated by IoT sensors.
- The combination provides high-performance data ingestion for handling large volumes of IoT telemetry.
- InfluxDB’s data retention policies help manage IoT data storage efficiently.
- Grafana can easily visualize the time-series data stored in InfluxDB through simple queries.
- Both tools are lightweight enough to run on edge computing devices for local IoT monitoring.
Deploy InfluxDB/Grafana
Create a network
- Isolation and security - The dedicated network isolates your containers from each other and from the host system, reducing the attack surface.
- Container-to-container communication - Containers in the same network can communicate using their container names (like “myinflux” and “mygrafana”) as hostnames, making connections simpler and more reliable.
- Port conflict prevention - You avoid potential port conflicts on the host, as multiple applications can use the same internal port numbers within their isolated network.
- Simpler configuration - Services can reference each other by container name instead of IP addresses, making configuration more maintainable.
Updated docker-compose.yml
Stop the previous containers
docker compose down
docker-compose.yml
name: influxdb3
services:
  influxdb3-core:
    container_name: influxdb3-core
    image: influxdb:3-core
    ports:
      - 8181:8181
    command:
      - influxdb3
      - serve
      - --node-id=node0
      - --object-store=file
      - --data-dir=/var/lib/influxdb3/data
      - --plugin-dir=/var/lib/influxdb3/plugins
    volumes:
      - ./.influxdb3/core/data:/var/lib/influxdb3/data
      - ./.influxdb3/core/plugins:/var/lib/influxdb3/plugins
    restart: unless-stopped

  influxdb3-explorer:
    image: influxdata/influxdb3-ui:latest
    container_name: influxdb3-explorer
    ports:
      - "8888:80"
    volumes:
      - ./.influxdb3-ui/db:/db:rw
      - ./.influxdb3-ui/config:/app-root/config:ro
    environment:
      SESSION_SECRET_KEY: "${SESSION_SECRET_KEY:-$(openssl rand -hex 32)}"
    restart: unless-stopped
    command: ["--mode=admin"]

  grafana:
    image: grafana/grafana-oss:latest
    container_name: grafana
    ports:
      - "3000:3000"
    volumes:
      - ./.grafana:/var/lib/grafana
    depends_on:
      - influxdb3-core
    restart: unless-stopped
docker compose up -d
InfluxDB UI
http://localhost:8888
Grafana
http://localhost:3000

userid/pwd: admin/admin
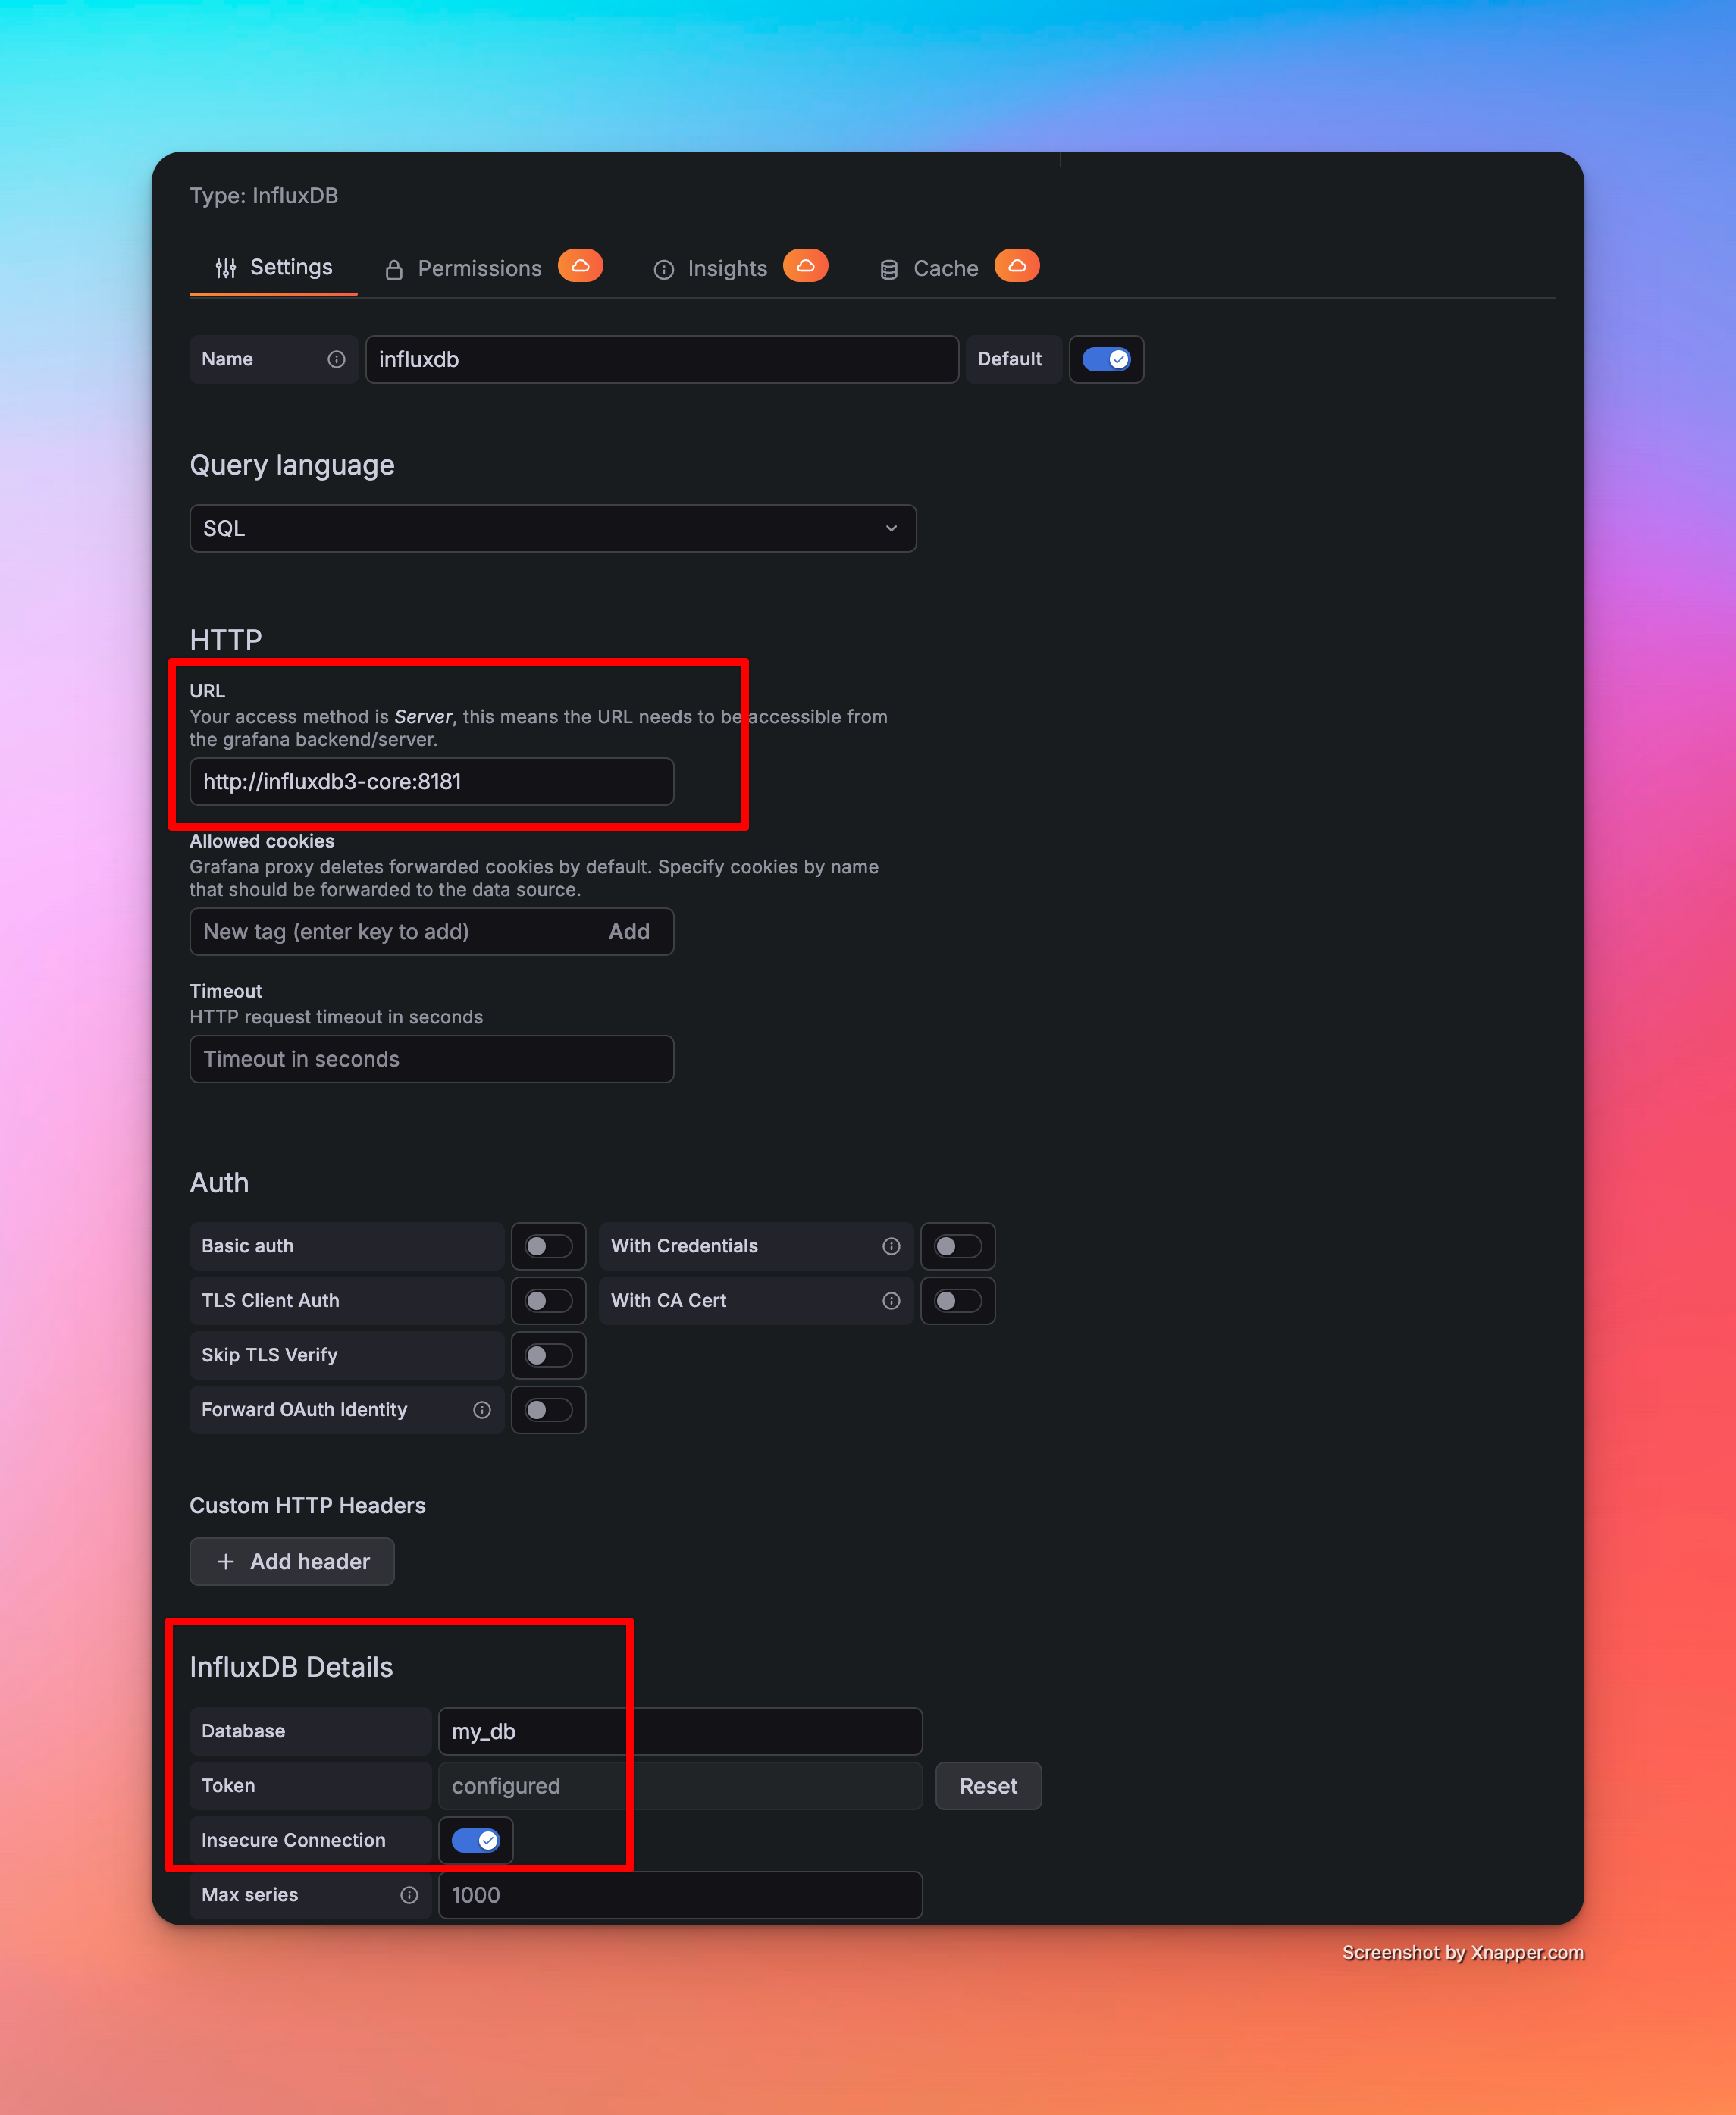
InfluxDB Host: http://influxdb3-core:8181 (as all 3 services are in same network)
Demo
Write SQL - Build Dashboards - Alerts